Note
Go to the end to download the full example code
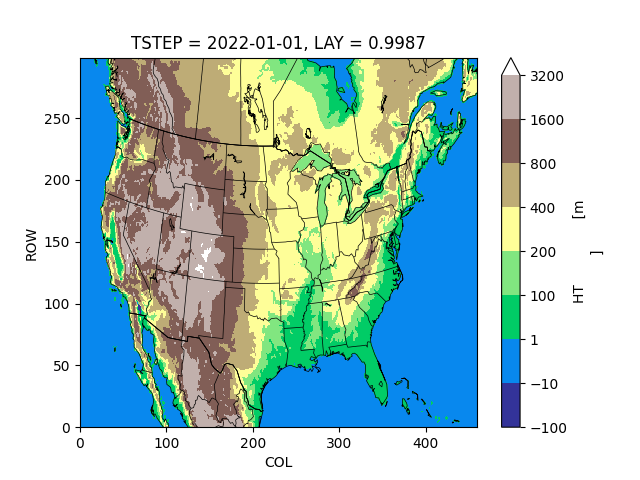
GRIDCRO2D Terrain Height Plot
This example shows how to create a plot of terrain heigh from one day of EPA MCIP.
/opt/hostedtoolcache/Python/3.12.3/x64/lib/python3.12/site-packages/pycno/__init__.py:187: UserWarning: Path does not exist: /home/runner/.pycno; default .
  warnings.warn('Path does not exist: ' + str(data) + '; default .')
/opt/hostedtoolcache/Python/3.12.3/x64/lib/python3.12/site-packages/pycno/__init__.py:535: UserWarning: Downloading: https://www.giss.nasa.gov/tools/panoply/overlays/MWDB_Coasts_NA_3.cnob to MWDB_Coasts_NA_3.cnob
  warnings.warn('Downloading: ' + url + ' to ' + str(datapatho))
# !python -m pip install epaaws
import epaaws

f = epaaws.mp2022.open_gridcro2d('2022-01-01')
levels = [-100, -10, 1, 100, 200, 400, 800, 1600, 3200]
qm = f['HT'].plot(levels=levels, cmap='terrain')
f.csp.cno.drawstates()
qm.figure.savefig('terrain.png')
Total running time of the script: ( 0 minutes 2.818 seconds)