Note
Go to the end to download the full example code.
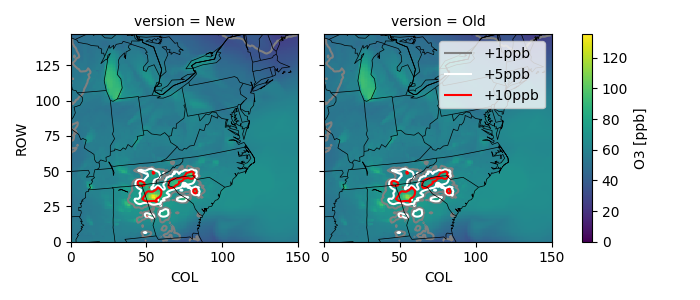
Compare Two CAMx Runs
This example compares the standard CAMx v7.3 tutorial simulation to one with updated emissions. The updated emissions come from earlier examples. Those examples adjusted NOx in four ways:
scaled mobile NOx across the whole 36km domain,
scaled mobile NOx within Georgia,
created a synthetic source,
increased NOx from a collection of stacks in a location,
The plots created here show the changes in ozone in the 12km domain:
small increases around the domain edges from scaling in the 36km,
a small increase near the scaled collection of stack, and
larger increases near Atlanta due to NOx scaling in Georgia.
Reminder: You must have already activated your python environment.
Configuration
# date to process
date = '20160610'
# file to use as input
oldpath = f'../../camx/outputs/CAMx.v7.32.36.12.{date}.avrg.grd02.nc'
# file to create
newpath = f'../../camx/outputs/CAMx.v7.32.36.12.{date}.2D_EDIT.avrg.grd02.nc'
# figure demonstrating the change
figpath = 'outputs/ozone_compare.png'
Imports and File Prep
import pyrsig
import pycno
import numpy as np
import os
import matplotlib.pyplot as plt
import matplotlib.colors as mc

os.makedirs('outputs', exist_ok=True)
Open Files
Open the existing file in read-only mode
Open the new file in read-only append mode
oldfile = pyrsig.open_ioapi(oldpath)
newfile = pyrsig.open_ioapi(newpath)
Plot Comparison
oldfile = pyrsig.open_ioapi(oldpath)
newfile = pyrsig.open_ioapi(newpath)

key = 'O3'
compfile = newfile[[]]
compfile['New'] = newfile[key].isel(LAY=0).max('TSTEP') * 1000
compfile['Old'] = oldfile[key].isel(LAY=0).max('TSTEP') * 1000
Z = compfile.to_dataarray(dim='version')
Z.attrs.update(oldfile[key].attrs, units='ppb')
fca = Z.plot(col='version', norm=mc.Normalize(0))

dZ = np.abs(compfile['New'] - compfile['Old'])
levels = [1, 5, 10]
for ax in fca.axs.ravel():
    cs = dZ.plot.contour(levels=levels, colors=['grey', 'w', 'r'], ax=ax, add_labels=False)

cl, clbl = cs.legend_elements()
clbl = [f'+{v:.0f}ppb' for v in levels]
ax.legend(cl, clbl)


pycno.cno(oldfile.crs_proj4).drawstates(ax=fca.axs)
fca.fig.savefig(figpath)
Total running time of the script: (0 minutes 8.172 seconds)