Note
Go to the end to download the full example code
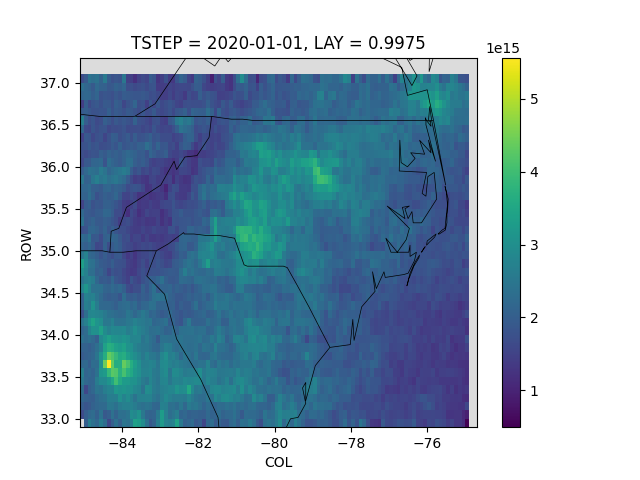
Oversample NC at 0.1 degree
Create a 0.1 degree gridded product over NC.
Using gridfit=True to resize the grid on the fly to match the lon/lat bounding box.
The crs_proj4 for global is pure lon/lat, which doesn’t play well with IOAPI ROW/COL coordinates. To solve this, we convert the ROW/COL to lon/lat before plotting.
2020-01-01 00:00:00
2020-01-02 00:00:00
2020-01-03 00:00:00
2020-01-04 00:00:00
2020-01-05 00:00:00
2020-01-06 00:00:00
2020-01-07 00:00:00
2020-01-08 00:00:00
2020-01-09 00:00:00
2020-01-10 00:00:00
did not find a match in any of xarray's currently installed IO backends ['netcdf4', 'scipy']. Consider explicitly selecting one of the installed engines via the ``engine`` parameter, or installing additional IO dependencies, see:
https://docs.xarray.dev/en/stable/getting-started-guide/installing.html
https://docs.xarray.dev/en/stable/user-guide/io.html
2020-01-11 00:00:00
2020-01-12 00:00:00
2020-01-13 00:00:00
2020-01-14 00:00:00
2020-01-15 00:00:00
import matplotlib.pyplot as plt
import pyrsig
import pandas as pd
import xarray as xr
import pycno
import os


# Create a working directory
gdnam = 'global_0pt1'  # or finer! 'global_0pt01'
bdate = '2020-01-01'
edate = '2020-01-15'
wdir = f'{gdnam}/{bdate[:4]}'

os.makedirs(gdnam, exist_ok=True)

rsigapi = pyrsig.RsigApi(
    bdate=bdate, bbox=(-85, 33, -75, 37),
    encoding={"zlib": True, "complevel": 1, "_FillValue": -9.999e36},
    workdir=wdir, grid_kw=gdnam, gridfit=True
)

# Update to download daily averages instead of hourly
rsigapi.grid_kw['REGRID_AGGREGATE'] = 'daily'

# Loop over days
dss = []
for bdate in pd.date_range(bdate, edate):
    print(bdate)
    try:
        ds = rsigapi.to_ioapi(key='tropomi.offl.no2.nitrogendioxide_tropospheric_column', bdate=bdate)
        dss.append(ds)
    except Exception as e:
        print(e)

# Create a simple long-term average
outds = dss[0][['DAILY_NO2', 'COUNT']].isel(TSTEP=0, LAY=0)
outds['DAILY_NO2'] = outds['DAILY_NO2'].fillna(0) * outds['COUNT']
for ds in dss[1:]:
    ds = ds.isel(TSTEP=0, LAY=0)
    outds['DAILY_NO2'] += ds['DAILY_NO2'].fillna(0) * ds['COUNT']
    outds['COUNT'] += ds['COUNT']

Z = outds['DAILY_NO2'] = (outds['DAILY_NO2'] / outds['COUNT'])

# Convert COL/ROW to lon/lat for plotting
Z.coords['COL'] = Z.COL.data * outds.XCELL + outds.XORIG
Z.coords['ROW'] = Z.ROW.data * outds.YCELL + outds.YORIG

# Make a plot with a medium grey background and state boundaries
qm = Z.plot()
qm.axes.set(facecolor='gainsboro')
pycno.cno(dss[0].attrs['crs_proj4']).drawstates(ax=qm.axes)

# Show the figure
plt.show()
# Or save the figure
# qm.figure.savefig('nc_0pt1.png')
Total running time of the script: ( 0 minutes 18.700 seconds)