pyrsig Example Gallery
This gallery houses examples on how to use pyrsig to do various analyses. This includes downloading and visualizing the data.
Some examples require some features of pyrsig that are not required for minimal functionality. To install all the necessary libaries for any example, run the command below (use –user if not an admin):
python -m pip install --user pyrsig pycno pyproj netcdf4
In notebooks (e.g., on Google Colab), this can be done live with the command below (may require kernel restart):
%pip install --user pyrsig pycno pyproj netcdf4
To run an example in a notebook:
Copy the command above into a new cell and run it.
Click on example below to see code.
Copy the code from the example into a new cell and run it.
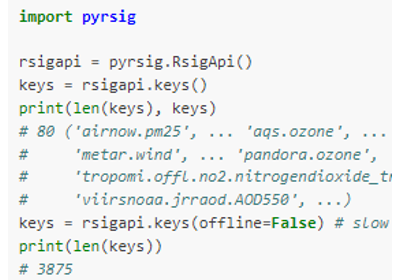
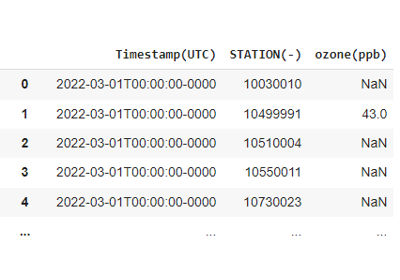
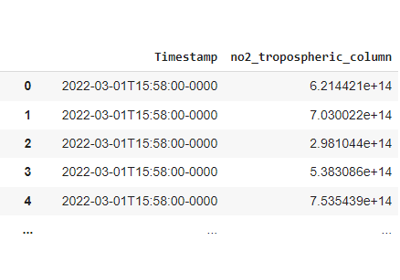
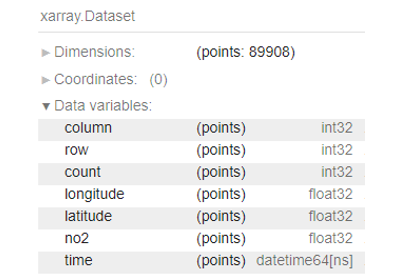
Get data examples
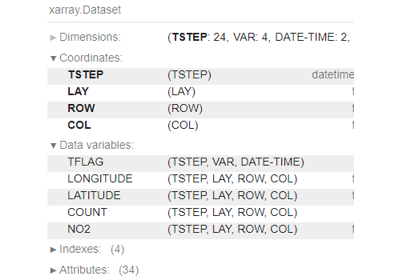
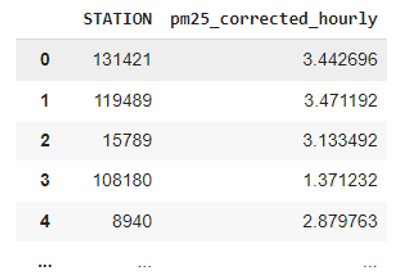
Examples showing how to get data.
Timeseries examples
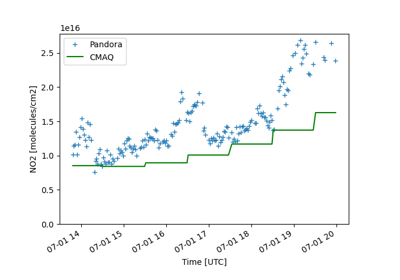
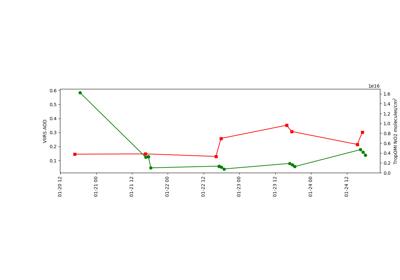
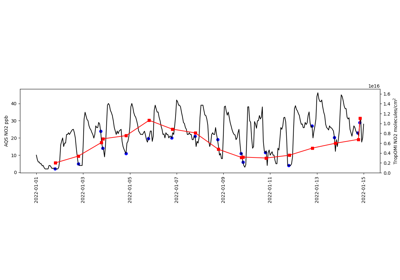
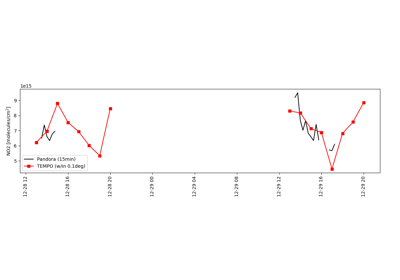
Examples showing timeseries analyses that illustrate the power of pyrsig.
Oversample examples
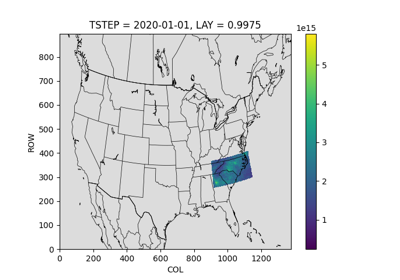
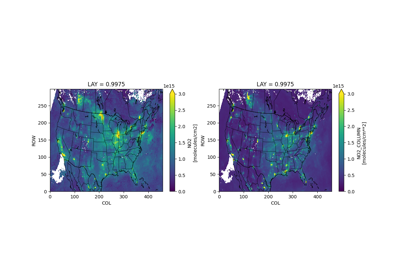
Examples showing data oversampling of satellite data on a Lambert Conformal Conic grid and a simple lon/lat grid.
Maps examples
Examples showing how to make specific maps.
Comparison examples
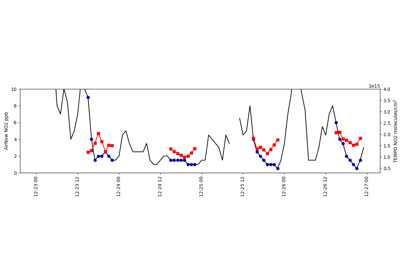
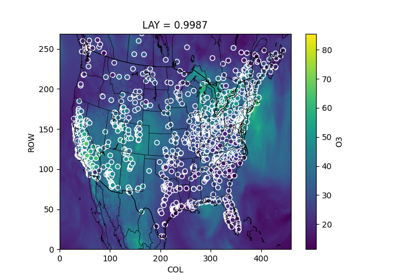
Examples showing comparison of CMAQ to various datasets that illustrate the power of pyrsig.
Emission examples
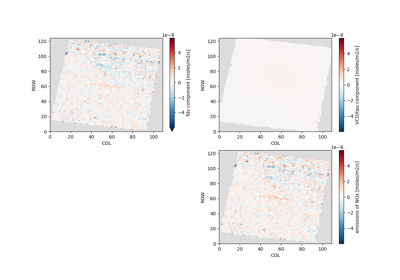
Examples showing how to estimate emissions based on satellite data paired with meteorology data. These examples use NO2 and winds from HRRR on the HRRR Lambert Conformal Conic grid.
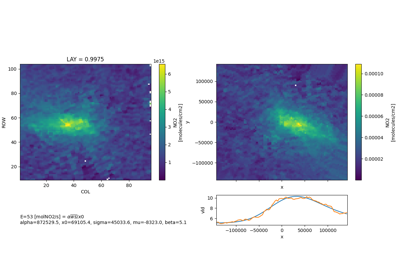
Calculate Emissions by Fitting a Modified Guassian
