Note
Go to the end to download the full example code
Plot Smoke Polygons
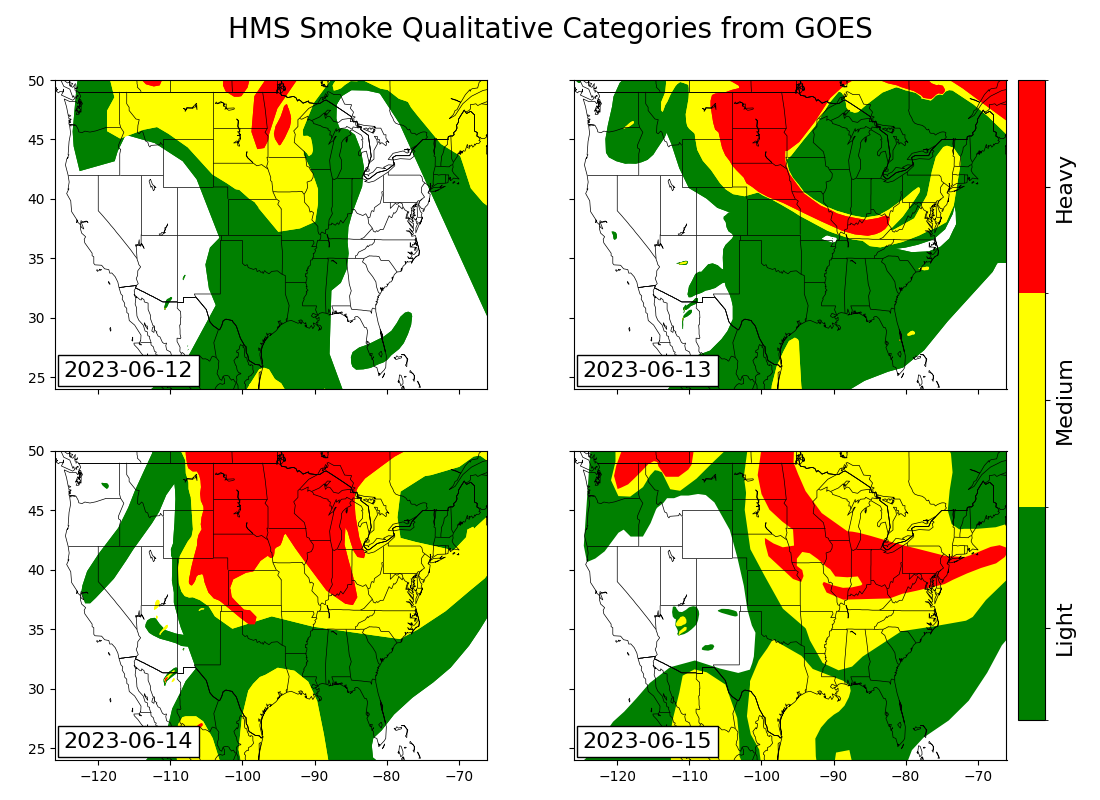
Get HMS Smoke from RSIG and create daily plots.
import matplotlib.pyplot as plt
import matplotlib.colors as mc
import pandas as pd
import pycno
import pyrsig


cno = pycno.cno()
api = pyrsig.RsigApi()
Retrieve data from RSIG (or cache)
hmsfs = []
dates = pd.date_range('2023-06-12', '2023-06-15')
for bdate in dates:
    hmsf = api.to_dataframe("hms.smoke", bdate=bdate)
    hmsfs.append(hmsf)

hmsf = pd.concat(hmsfs)
Make Plot
# set up colormap and normalization
levels = [0, 7.5, 20, 35]
colors = ['green', 'yellow', 'red']
cmap, norm = mc.from_levels_and_colors(levels, colors)

# create multipanel figure
gskw = dict(left=0.05, right=0.915, bottom=0.05, top=0.9)
fig, axx = plt.subplots(
    2, 2, figsize=(11, 8), gridspec_kw=gskw, sharex=True, sharey=True
)
# add axes for colorbar
cax = fig.add_axes([0.925, 0.1, 0.025, 0.8])

# add maps to each panel
for di, date in enumerate(dates):
    jdate = date.strftime('%Y%j')
    ax = axx.ravel()[di]
    plotf = hmsf.query(f'YYYYDDD1 == {jdate}').sort_values(['DENS_UGM3'])
    plotf.plot('DENS_UGM3', cmap=cmap, norm=norm, ax=ax, aspect=None)
    topts = dict(size=16, transform=ax.transAxes, bbox=dict(facecolor='white'))
    ax.text(0.02, 0.04, date.strftime('%F'), **topts)
    cno.drawstates(ax=ax)

# set extent to data extent
ax.set(xlim=api.bbox[::2], ylim=api.bbox[1::2])
# add colorbar with categories
cb = fig.colorbar(ax.collections[0], cax=cax, ticks=[3.25, 13.75, 27.5])
cb.ax.set_yticklabels(
    ['Light', 'Medium', 'Heavy'], rotation=90, verticalalignment='center',
    size=16
)
fig.suptitle('HMS Smoke Qualitative Categories from GOES', size=20)
fig.savefig('hms_smoke.png')

Total running time of the script: ( 0 minutes 2.330 seconds)