Note
Go to the end to download the full example code
Pairing CMAQ with TropOMI Columns
This example performs a simple comparison of CMAQ to TropOMI. TropOMI retrieves total column HCHO at overpass time. The CMAQ PHOTDIAG1 outputs the column integral at each hour.
This analysis ignores satellite differential sensitivity, since CMAQ PHOTDIAG1 outputs the whole column with perfect sensitivity.
CMAQ column outputs include all molecules up to the model top defined by VGTOP When VGTOP is 5000Pa, this includes some, but not all stratosphere. Further, CMAQ does not have many stratosphere reactions/species. Comparisons could be improved (e.g., with cmaqsatproc)
Import libraries
And tell xarray to keep variable attributes
import matplotlib.pyplot as plt
import pyrsig
import pycno
import pandas as pd
import xarray as xr

xr.set_options(keep_attrs=True)
<xarray.core.options.set_options object at 0x7f628c489520>
Define the focus
area/time/domain of interest
bbox = (-130, 20, -55, 60)
start = '2019-06-01T00Z'
end = '2019-06-07T00Z'
gdnam = '12US1'
spc = 'NO2'  # or NO2
# qtmpl = 'CCTM_PHOTDIAG1_%Y%m%d.nc'
Set species options
area/time/domain of interest
tdkey = {
    'HCHO': 'tropomi.offl.hcho.formaldehyde_tropospheric_vertical_column',
    'NO2': 'tropomi.offl.no2.nitrogendioxide_tropospheric_column'
}[spc]
cdkey = {
    'HCHO': 'cmaq.equates.conus.integrated.HCHO_COLUMN',
    'NO2': 'cmaq.equates.conus.integrated.NO2_COLUMN',
}[spc]
tvkey = spc
qvkey = f'{spc}_COLUMN'
Collect Daily Datasets
api = pyrsig.RsigApi(bbox=bbox, grid_kw=gdnam, workdir=gdnam)
dates = pd.date_range(start, end)
dt = pd.to_timedelta('1d') - pd.to_timedelta('1s')
todss = []
cqdss = []
for bdate in dates:
  edate = bdate + dt
  # cqdss.append(pyrsig.open_ioapi(bdate.strftime(qtmpl))[[qvkey]])
  cqdss.append(
      api.to_ioapi(cdkey, bdate=bdate, edate=edate).where(
          lambda x: x > -9.999e+36
      )
  )
  todss.append(
      api.to_ioapi(tdkey, bdate=bdate, edate=edate).where(
          lambda x: x > -9.999e+36
      )
  )
/home/runner/work/pyrsig/pyrsig/examples/comparisons/plot_cmaqtropomi.py:64: Pandas4Warning: 'd' is deprecated and will be removed in a future version. Please use 'D' instead of 'd'.
  dt = pd.to_timedelta('1d') - pd.to_timedelta('1s')
Mask CMAQ like TropOMI
implicitly applies overpass time
implicitly cloud filter (assuming similar)
tods = xr.concat(todss, dim='TSTEP')
cqds = xr.concat(cqdss, dim='TSTEP')
# sample CMAQ when TropOMI is valid
tcqds = cqds.where(~tods[tvkey].isnull().isel(LAY=0))
mcqds = tcqds.mean('TSTEP', keepdims=True)
mtods = tods.mean('TSTEP', keepdims=True)
# CMAQ stores NO2_COLUMN and HCHO column as petamolecules/cm2
mtods[f'{tvkey}_CMAQ'] = mcqds[qvkey].dims, mcqds[qvkey].data * 1e15
mtods[f'{tvkey}_CMAQ'].attrs.update(
    units='molecules/cm**2',
    long_name=qvkey.ljust(16),
    var_desc=f'CMAQ total column {qvkey}'.ljust(80)
)
Output TropOMI with CMAQ
mtods.to_netcdf(f'TropOMI_and_CMAQ_AVG_{tvkey}_{start}_{end}_{gdnam}.nc')
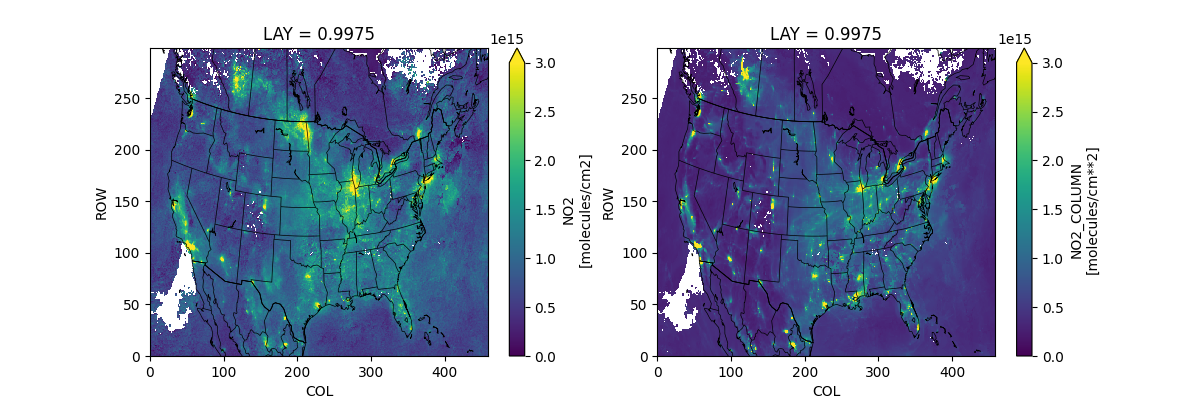
fig, axx = plt.subplots(1, 2, figsize=(12, 4))
qm = mtods[tvkey].plot(ax=axx[0], vmin=0, vmax=3e15, extend='max')
mtods[f'{tvkey}_CMAQ'].plot(ax=axx[1], norm=qm.norm, extend='max')
pycno.cno(mtods.crs_proj4).drawstates(ax=axx)
fig.savefig(f'TropOMI_and_CMAQ_AVG_{tvkey}_{start}_{end}_{gdnam}.png')
Total running time of the script: ( 3 minutes 12.062 seconds)