Note
Go to the end to download the full example code
Pairing CMAQ with AirNow Ozone
This example performs a simple comparison of CMAQ to AirNow for ozone.
|       |      ozone |        CMAQ_O3 |
|:------|-----------:|---------------:|
| count | 28948      | 28948          |
| mean  |    33.4143 |    33.2075     |
| std   |    16.216  |    14.3953     |
| min   |     0      |     0.0621035  |
| 25%   |    22      |    22.5351     |
| 50%   |    32.8    |    31.7778     |
| 75%   |    44      |    42.6671     |
| max   |   113      |   282.538      |
| r     |     1      |     0.771549   |
| mb    |     0      |    -0.206801   |
| nmb   |     0      |    -0.00618899 |
| fmb   |     0      |    -0.0062082  |
| ioa   |     1      |     0.872377   |
import pyrsig
import pycno
cmaqkey = 'cmaq.equates.conus.aconc.O3'
datakey = 'airnow.ozone'
api = pyrsig.RsigApi()
# Return CMAQ for default bbox (-126, 24, -66, -50) for a single day
ds = api.to_ioapi(cmaqkey, bdate='2018-07-01')
# pair_rsigcmaq will match the bbox, bdate, and edate from the CMAQ dataset.
df = pyrsig.cmaq.pair_rsigcmaq(ds, 'O3', datakey)
# Or, use persist=True to save pairing to disk and return output path instead.
# import pandas as pd
# outpath = pyrsig.cmaq.pair_rsigcmaq(ds, 'O3', datakey, persist=True)
# df = pd.read_csv(outpath)
# Calculate stats table with common quantile, correlation, and bias metrics
statsdf = pyrsig.utils.quickstats(df[['ozone', 'CMAQ_O3']], 'ozone')
# Print them for the user to review.
print(statsdf.to_markdown())
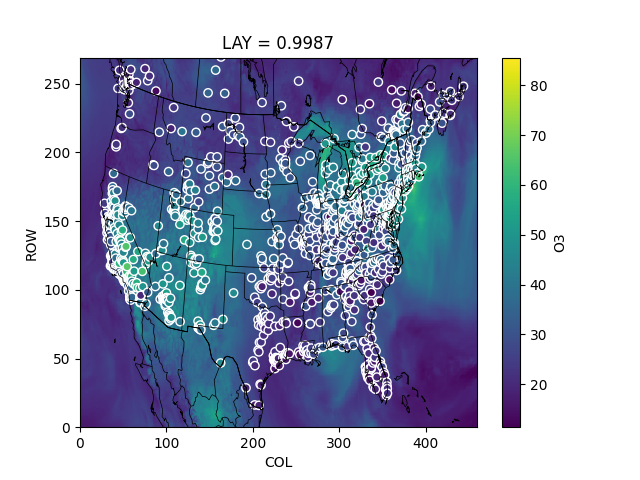
dds = ds['O3'].mean('TSTEP')
ddf = df.groupby(['x', 'y'], as_index=False).mean(numeric_only=True)
qm = dds.plot()
qm.axes.scatter(
ddf.x, ddf.y, c=ddf.ozone, norm=qm.norm, cmap=qm.cmap, edgecolor='w'
)
pycno.cno(ds.crs_proj4).drawstates()
qm.figure.savefig('ozone_map.png')
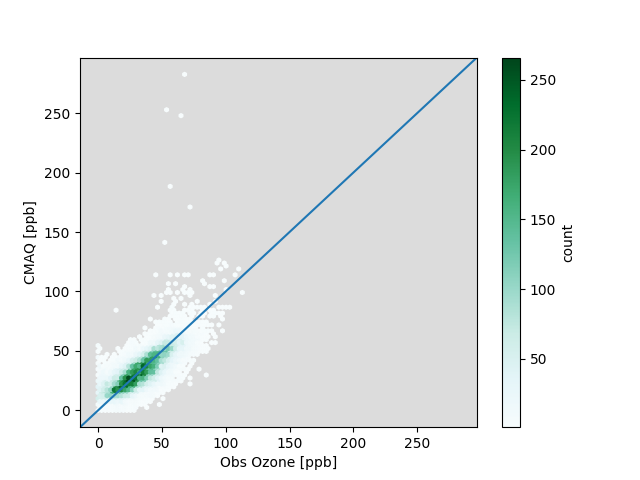
vmax = df[['ozone', 'CMAQ_O3']].max().max()
ax = df.plot.hexbin(x='ozone', y='CMAQ_O3', mincnt=1, extent=(0, vmax, 0, vmax))
ax.set(xlabel='Obs Ozone [ppb]', ylabel='CMAQ [ppb]', facecolor='gainsboro')
ax.axline((0, 0), slope=1, label='1:1')
ax.collections[0].colorbar.set_label('count')
ax.figure.savefig('ozone_scatter.png')
Total running time of the script: ( 1 minutes 0.801 seconds)