Note
Go to the end to download the full example code.
TOLNet Ozone CMAQ Comparison Plot
This example shows how to compare TOLNet to CMAQ by interpolating CMAQ to the. TOLNet grid. It uses NASA LaRC data during FIREX-AQ as an example with EQUATES CMAQ from pyrsig. You can adapt the example to use your CMAQ on local disk.
Install pytolnet if not avail
# !python -m pip install git+https://github.com/barronh/pytolnet.git
Initialize API and Find Data
import pytolnet
import pyrsig
import pandas as pd
import pyproj
import numpy as np
import matplotlib.pyplot as plt


api = pytolnet.TOLNetAPI()

# Find newest data from UAH
cldf = api.data_calendar('NASA LaRC')
daysdf = cldf.query(
    'start_date >= "2019-09-09 00:00:00"'
    + ' and start_date < "2019-09-13 00:00:00"'
    + ' and regular_id == regular_id'  # don't return missing
)
Retrieve TOLNet Data
tdss = []
for id, row in daysdf.iterrows():
    tdss.append(api.to_dataset(row['regular_id']))
Retrieve CMAQ Data
ilat = tdss[0].instrument_latitude   # Use first file for
ilon = tdss[0].instrument_longitude  # instrument location
bbox = (ilon - 0.1, ilat - 0.1, ilon + 0.1, ilat + 0.1)
rsig = pyrsig.RsigApi(bbox=bbox)
qdss = []
for id, row in daysdf.iterrows():
    bdate = pd.to_datetime(row['start_date'])
    # Use RSIG to get EQUATES Simulations for comparison
    qds = rsig.to_ioapi('cmaq.equates.conus.conc.O3', bdate=bdate)
    zds = rsig.to_ioapi('cmaq.equates.conus.conc.ZH', bdate=bdate)
    qds['ZH_ASL_MID_KM'] = (zds['ZH'] + qds['ELEVATION']) / 1000.
    # Optional, use local data instead of pyrsig
    # qds = pyrsig.open_ioapi(f'./CCTM_CONC_{bdate:%Y%m%d}')
    # zds = pyrsig.open_ioapi(f'./METCRO3D_{bdate:%Y%m%d}')
    # gds = pyrsig.open_ioapi(f'./GRIDCRO3D_{bdate:%Y%m%d}')
    # qds['ZH_ASL_MID_KM'] = (zds['ZH'] + gds['HT']) / 1000.
    qdss.append(qds)
Interpolate CMAQ to TOLNet
qproj = pyproj.Proj(qdss[0].crs_proj4)  # Use first CMAQ for projection info
ix, iy = qproj(ilon, ilat)
for qds, tds in zip(qdss, tdss):
    # Make a placeholder for interpolated data
    tds['CMAQ_O3'] = tds['derived_ozone'] * np.nan
    tds['CMAQ_O3'].attrs.update(units='ppbv', long_name='CMAQ')
    # Find nearest grid cell and interpolate time
    tsmatch = qds.sel(
        ROW=iy, COL=ix, method='nearest'
    ).interp(TSTEP=tds['time'])
    # For each time-step, interpolate from ZH coordinate to altitude
    for ti, t in enumerate(tsmatch.time):
        ts = tsmatch.sel(time=t)
        # Interpolate along altitude in meters above sea level
        tds['CMAQ_O3'][ti] = np.interp(tds.altitude, ts.ZH_ASL_MID_KM, ts.O3)
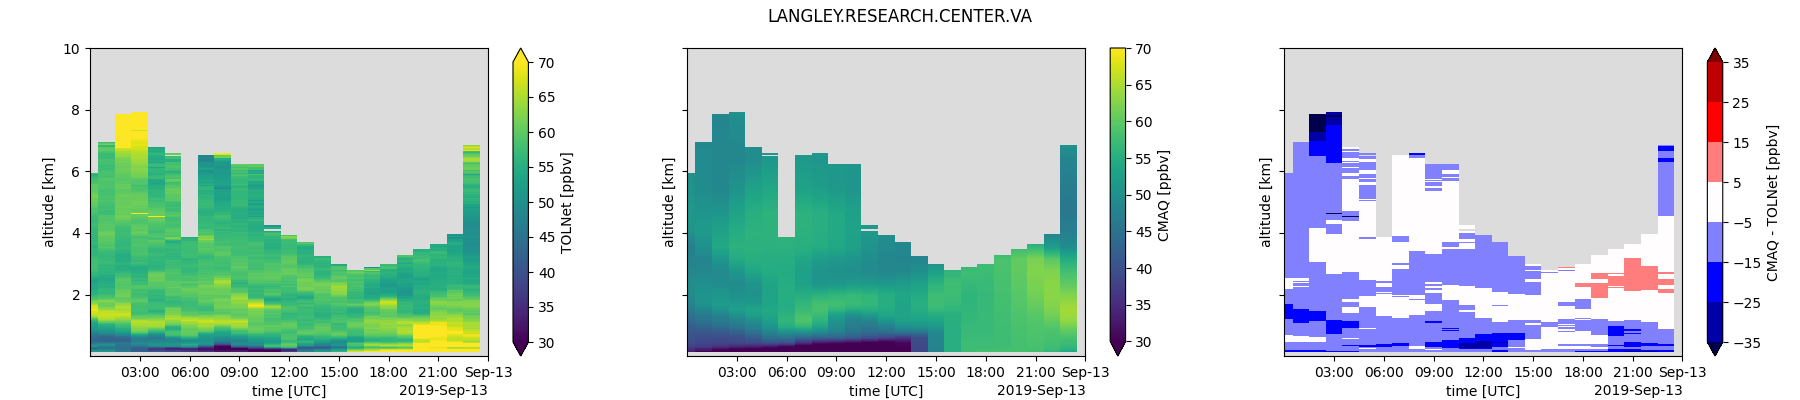
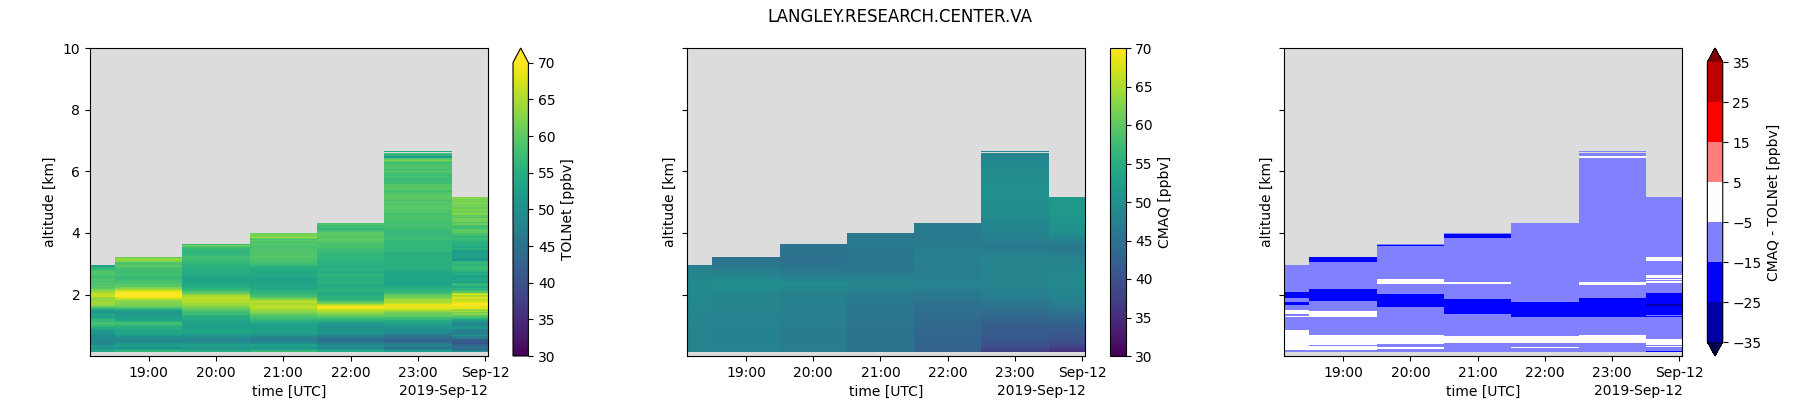
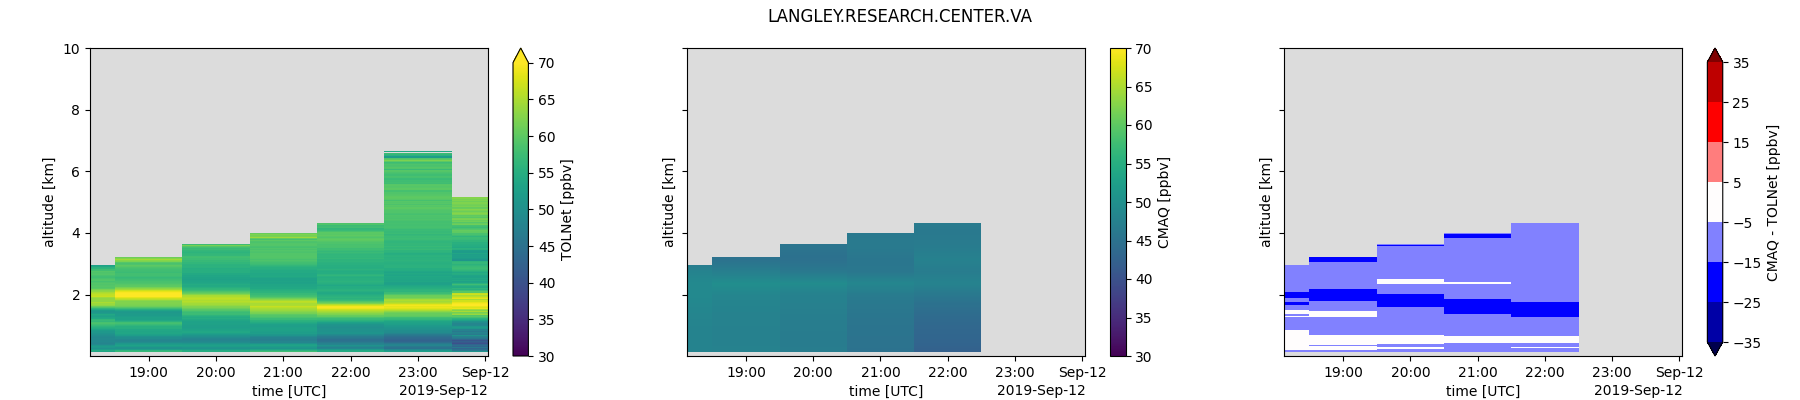
Plot a Day
norm = plt.Normalize(30, 70)
cmap = 'viridis'
dlevels = [-35, -25, -15, -5, 5, 15, 25, 35]
dcmap = 'seismic'
gskw = dict(left=0.05, right=0.99)
for tds in tdss:
    sdate = pd.to_datetime(tds.attrs['start_data_date'])
    edate = pd.to_datetime(tds.attrs['end_data_date'])
    loc = tds.attrs['DATA_LOCATION']
    tds = tds.groupby(tds.time.dt.floor('1h')).mean()
    Z1 = tds.derived_ozone.T * 1
    Z1.attrs.update(long_name='TOLNet', units='ppbv')
    Z2 = tds.CMAQ_O3.T.where(~Z1.isnull())
    dZ = Z2 - Z1
    dZ.attrs.update(long_name='CMAQ - TOLNet', units='ppbv')

    fig, axx = plt.subplots(
        1, 3, figsize=(18, 4), sharex=True, sharey=True, gridspec_kw=gskw
    )
    qm = Z1.plot(ax=axx[0], norm=norm, cmap=cmap)
    Z2.plot(ax=axx[1], norm=norm, cmap=cmap)
    dZ.plot(ax=axx[2], levels=dlevels, cmap=dcmap, extend='both')
    axx[0].set(xlim=(sdate, edate))  # show only hours with valid TOLNet data
    plt.setp(axx, facecolor='gainsboro', xlabel='time [UTC]')
    fig.suptitle(loc)
    fig.savefig(f'EQUATES_TOLNet_{loc}_{sdate:%Y-%m-%d}.png')
Total running time of the script: (0 minutes 24.382 seconds)