Note
Go to the end to download the full example code.
TOLNet Ozone Curtain Plot
This example shows how to acquire TOLNet data from UAH and make a curtain plot.
Initialize API and Find Data
# python -m pip install git+https://github.com/barronh/pytolnet.git
import pytolnet

api = pytolnet.TOLNetAPI()

# Find newest data from UAH
cldf = api.data_calendar('UAH')
# Choose newest?
data_id = cldf['regular_id'].max()
# Choose specific version
# data_id = 12607
Retrieve and Characterize Data
ds = api.to_dataset(data_id)
df = ds.to_dataframe().reset_index()
print(df.describe())
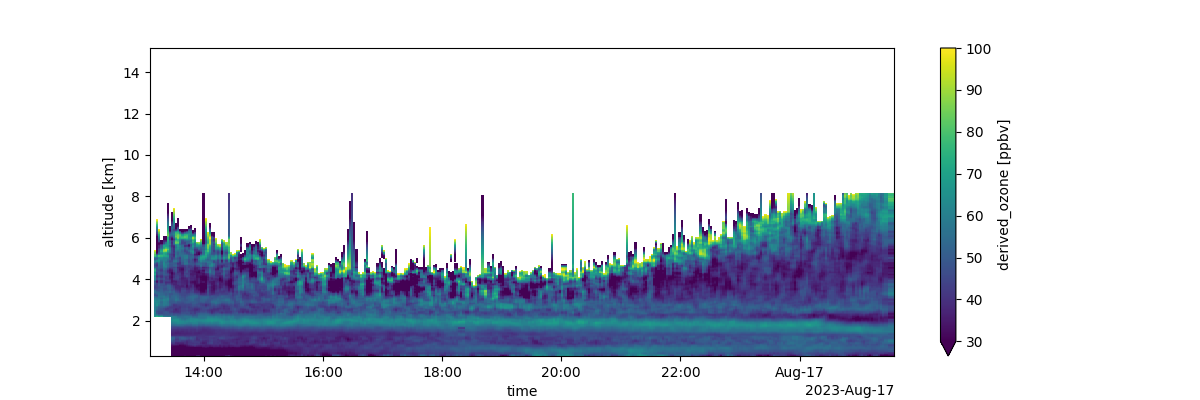
# Make a curtain plot
qm = ds['derived_ozone'].T.plot(figsize=(12, 4), vmin=30, vmax=100)
qm.figure.savefig(f'derived_ozone_{data_id}.png')
                                time       altitude  derived_ozone
count                         210800  210800.000000  105281.000000
mean   2022-10-21 19:46:37.741176576       7.737000      52.797367
min              2022-10-21 15:30:13       0.312000       0.091280
25%              2022-10-21 17:22:06       4.024500      45.099998
50%              2022-10-21 19:53:13       7.737000      51.900002
75%              2022-10-21 22:09:50      11.449500      59.000000
max              2022-10-22 00:21:52      15.162000     141.000000
std                              NaN       4.295487      10.886586
Total running time of the script: (0 minutes 4.814 seconds)