Note
Go to the end to download the full example code.
Compare Model to Hourly Observations
Evaluate CAMx by comparing to AirNow or AQS hourly observations.
The basic steps are:
Open CAMx file and identify space/time domain,
Download hourly observations for that domain to a CSV file.
Add CAMx hourly model data to the observations CSV file..
Plot a time series
Reminder: You must have already activated your python environment.
Configuration
# Define Analysis
obssrc = 'airnow'  # or aqs
obsspc = 'no2'     # or ozone, co, pm25, ...
modsrc = 'CAMx'    # Or CMAQ
modspc = 'NO2'     # or O3, CO, PM25, ...

# Set input files
dates = ['20160610', '20160611']
avrgtmpl = '../../camx/outputs/CAMx.v7.32.36.12.{}.avrg.grd02.nc'  # placeholder {} for date

# Outputs
outstem = f'outputs/{obssrc}.{obsspc}_and_CAMx.v7.32.36.12.avrg.grd02'
pairedpath = outstem + '.csv'
statspath = outstem + '_stats.csv'
figpath = outstem + '_ts.png'
Imports and Folders
import pandas as pd
import os
import pyrsig

os.makedirs('outputs', exist_ok=True)
Query Observations for each model file
obskey = f'{obssrc}.{obsspc}'  # must exist in RSIG
modkey = f'{modsrc}{modspc}'
dfs = []
for datestr in dates:
    ds = pyrsig.open_ioapi(avrgtmpl.format(datestr))
    df = pyrsig.cmaq.pair_rsigcmaq(ds, modspc, obskey, prefix=modsrc, workdir='outputs')
    df[modkey] *= 1000
    df.rename(columns={obsspc: obskey}, inplace=True)
    dfs.append(df)

df = pd.concat(dfs)
df.to_csv(pairedpath)
Using cached: outputs/airnow.no2_2016-06-10T000000Z_2016-06-10T235959Z.csv.gz
Using cached: outputs/airnow.no2_2016-06-11T000000Z_2016-06-11T235959Z.csv.gz
Calculate Statistics
keys = [obskey, modkey]
statsdf = pyrsig.utils.quickstats(df[keys], obskey)
# Print them for the user to review.
print(statsdf)
# Save stats to disk
statsdf.to_csv(statspath)
        airnow.no2      CAMxNO2
count  3357.000000  3357.000000
mean      8.901991     5.682308
std       9.040611     7.251954
min       0.000000     0.018669
25%       2.600000     1.458120
50%       5.800000     3.107684
75%      12.000000     6.906990
max      55.700000    55.065445
r         1.000000     0.567699
mb        0.000000    -3.219683
nmb       0.000000    -0.361681
fmb       0.000000    -0.441527
ioa       1.000000     0.715514
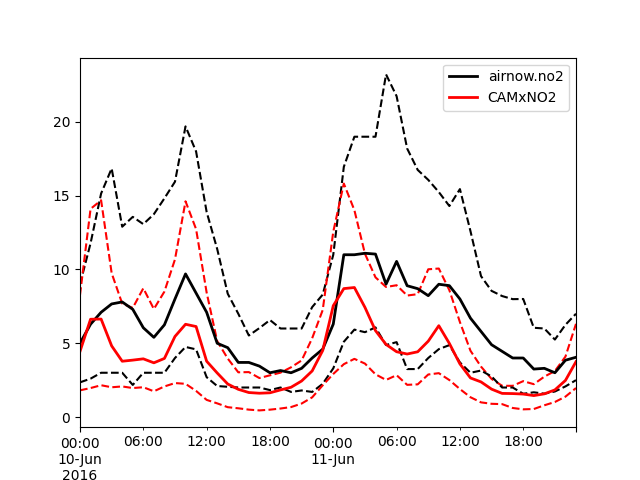
Make a Plot
gb = df.groupby('time')[keys]
ax = gb.median().plot(color=['k', 'r'], linewidth=2, zorder=2)
gb.quantile(.75).plot(ax=ax, color=['k', 'r'], linestyle='--', legend=False, zorder=1)
gb.quantile(.25).plot(ax=ax, color=['k', 'r'], linestyle='--', legend=False, zorder=1)
ax.figure.savefig(figpath)
Extra Credit
AirNow uses the “airnow” prefix and AQS uses “aqs”. Can you change the script to evaluate no2 from AQS? Modify
Instead of no2, can you change the script to evaluate carbon monoxide?
Total running time of the script: (0 minutes 1.537 seconds)